The Cook Political Report’s House projections are rather conservative. In 2008 only one flip was not marked competitive, and that was Louisiana’s 2nd CD, in which Joseph Cao upset William Jefferson. I naturally give him a pass on that seat.
What do Cook’s 2010 projections say, and what do we learn from them?
Comparing Cook’s 2008 ratings with the actual results, “Likely” seats fell 100% for their parties, which I’m going to call 99% for the sake of modeling. “Lean” seats fell 21/23, which I’m calling 90% for the model. “Toss ups” fell 18 Republican, 17 Democrat, which meshes with a 50% win probability for each side.
That it takes a 90% win chance to move a seat away from Toss Up to me suggests a high degree of conservatism. This conservatism served Cook well, too. As I said before, only one non-competitive race changed hands, and that was in the remarkable case of Cao defeating Jefferson in LA-2, a district with an overwhelming registration advantage for Democrats. But beyond that, in each category I detect no partisan bias.
Clearly, since I’ve calibrated my modeling of Cook’s categories with the 2008 results, my simulation of the 2008 House election using the Cook 2008 final ratings matches the actual results: D+21 mean and mode for the election.
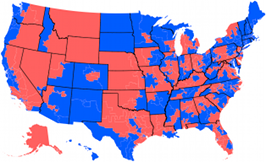
So let’s turn to 2010. It’s early and many races still have contested primaries in progress, so I expect these numbers to change. But for now, my simulation has Cook projecting 2010 to be the mirror image of 2008: mean and mode R+20. Republicans want 40 for the majority.
That said, Cook gives Republicans a net 99 seat advantage in competitive seats, with Republicans holding 17 and Democrats holding 116. Clearly that R+99 outcome is not in the realm of realism, but it is currently Cook’s upper bound for Republicans this year. For comparison, the same upper bound for Democrats in the final 2008 tally was D+52.
I will be interested to see if Cook moves more races into the Toss Up category as the primaries conclude and we move closer to November.
Update: I’ve been asked to check how the Cook Political Report estimates looked at this point in the last cycle. So, I ran the simulation using the April 24, 2008 ratings. Result: D+6 mean, D+5 mode. These numbers can move sharply.
![Simulating the House election via Cook [Updated]](http://unlikelyvoter.com/wp-content/uploads/2010/05/Cook-House-4-29-2010.png)


 House of Representatives Swingometer
 Electoral College Swingometer
Rep holding 17, Dem holding 116, that is a 99 seat advantage…for Dems…Moe, how soon would you expect to have access to general election polling for all the house seats and not just the competitive house seats. This year, Cook’s idea of what is or is not competitive would seem to be questionable, at least to me.
Honestly I don’t expect to see a whole lot of public House polling. There are just too many seats.
But what there is, I expect to see starting in mid June. By then we should be basically done with the primaries.
I may also need to run a donation drive to get my self a Cook Political Report subscription. That may net me more poll access, but I’ll have to ask around.
Oh and the 99 seat advantage IS for us. When they’re having to spend all their DSCC money on defense, while the NRCC money goes on offense, then it means we will necessarily be gaining seats.
I mean Neil, not Moe. Sorry. Must be all the natural or man caused disasters fogging my brain..
Ha! Well Moe *did* inspire this post with *his* post on Cook, so it all evens out.
It is fascinating to see how numbers can give us a glimpse of what is to come, without necessarily being biased. Love your statistical abilities, Neil.
Thanks for the explanation on the definition of what “holding” is. I sorta figured it out after I walked away from the keyboard. Mighty fascinating election. Will be studied for decades into the future. Oh, and I keep meaning to tell you how great it is that rsrh is available. One of my favorites!