October marches on, and so does the House generic ballot polling. Last week Republicans were on the rebound and this week every single generic is showing Republicans back on top, as has not been the case lately.
So let’s see what the damage is.
As usual, to run my projection I take the recent generic ballot polls from Real Clear Politics, subtract out the undecideds and third party votes to get a pure two party vote, then compare that with the two party vote of 2008.
From there, I take a weighted average of the swing from 2008 to now in each poll, with Likely Voter polls counting double the weight of Registered Voter polls. That average is then run through the Swingometer to get a projected House composition.
| Two party splits | ||||
|---|---|---|---|---|
| Poll | Filter | D | R | Swing |
| 2008 | Actual | 56 | 44 | – |
| Rasmussen 10/10 | LV | 45 | 55 | R+22 |
| Gallup High 10/10 | LV44 | 56 | R+24 | |
| Gallup Low 10/10 | LV | 41 | 59 | R+30 |
| CNN/OR 10/7 | LV | 46 | 54 | R+20 |
| CBS 10/5 | LV | 45 | 55 | R+22 |
| Democracy Corps 10/4 | LV | 47 | 53 | R+18 |
| ABC/WaPo 10/3 | LV | 47 | 53 | R+18 |
That Gallup Low poll is still awfully out there on a limb, though it’s not quite as far as it was last week. It’s going to give a little lift to the average though since this week saw no Newsweek or similar poll going out the other way.
All are Likely Voter polls this time, so no weighting is needed, and the mean swing is 22.0. Giving that figure to Swingometer returns a 60 seat Republican gain over 2008, and a 238 R-197 D House majority.
Once again, we’re back into the kind of midterm territory more often seen before the Eisenhower administration and mostly ween before World War II, when Presidential coattails were massive and the midterms corrected for them.


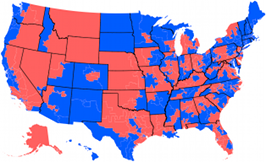 House of Representatives Swingometer
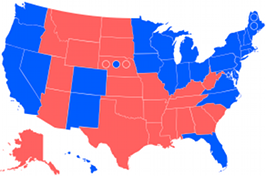 Electoral College Swingometer
Your short URL from the redstate page twitter feed is broke.
I had to type in “unlikelyvoter.com” to come find this.