Today I use a poll of a primary race between two Democrats to illustrate my initial model of a horserace election poll. Until the general election season begins in earnest, the primaries are all we have and I intend to use them as a warmup.
My initial model is a simple one, designed to give me an easy starting point with clear math and reasoning behind it. Take last week’s Daily Kos/Research 2000 poll of Pennsylvania, specifically the primary race between moderate Senator Arlen Specter and the man closer to his party’s mainstream, Joe Sestak.
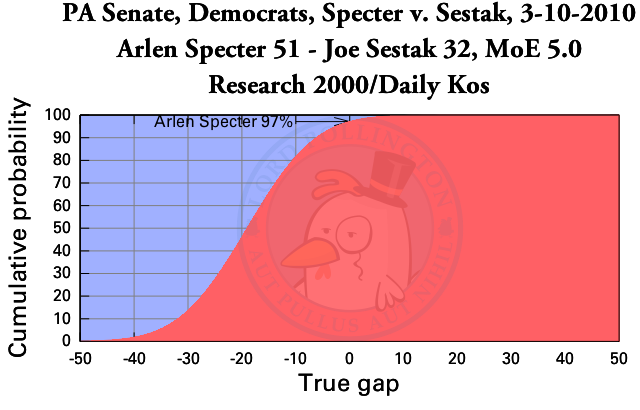
The poll itself has three key figures: Specter 51, Sestak 32, Margin of Error 5 (the MoE is 4 for the general election figures in the poll, but 5 for the primary races, as is typical for these kinds of polls). My process boils those down to one number: If the primary election were held last week, Specter had a 97% probability of victory, says this poll.
This overwhelming reading makes sense if we remember the traditional warning: incumbents over 50% tend to be safe. That piece of conventional wisdom is something I intend to watch in the coming months, whether my analysis bears out that prediction, and if I disagree, whether it’s proven right, or I am.
Math ahead. I normally won’t bore with so much gory detail of what I’m doing, but I feel it proper to explain it at least once, so that my work can be independently verified by someone with enough time and interest in doing so.
How do I get that number, though? It’s relatively simple math, but I’ll keep that to a minimum. First off, we remember that any poll is unlikely to be a perfectly representative sample of the voting population. We figure that based on this poll, each number is somewhere in the neighborhood of the reading given, and the size of that neighborhood depends on the size of the margin of error. In my initial model, I assume Sestak’s actual support level is somewhere on a bell curve (for the mathematicians, a normal distribution) centered at 32, and Specter’s is on a separate bell curve centered at 51.
Already the mathematicians are sputtering. I’m assuming the two values are independent. Whether that is a safe assumption, time and testing will tell. There are reasonable explanations to be found for both an independent model and a dependent model, but I don’t think this is a question that can be answered with reasoning alone. I need hard testing, and my projections this year will help with that.
Moving on, once I get the two bell curves, I subtract one from the other, getting a third bell curve, this time describing the lead. Mathematically, subtracting two indepedent bell curves is easy. I just subtract the peaks, and make it as wide as both combined. This means our estimate of the lead is half as accurate as that of the individual Sestak and Specter support estimates.
Once I get this estimate of the lead, the final step can’t be described with anything but math jargon. I take my normal distribution and plot the cumulative distribution function. The value at zero is the probability that one candidate has a lead. That number gets a label in my individual poll charts, such as the one above.
And that is how I hope to make sense out of a poll.


 House of Representatives Swingometer
 Electoral College Swingometer
Comments
No Responses to “Specter v Sestak, Research 2000/Daily Kos, 3-10-2010”