Until now, Gallup and Rasmussen Reports have generally pointed in the same direction with their generic ballot polls. If they’ve differed, it’s been in the magnitude.
This week, that has changed. How big a difference is it, and what does the Swingometer say about it all? Let’s find out.
[More]
National Journal noticed an event in the Gallup voter enthusiasm polling: Republicans have gone off the scale, while Democrats have fallen far off from 2006.
Since 1994 the numbers have tracked with victory and defeat, with the party ahead in enthusiasm winning the House, but this scale is… well, just look.
[More]
The new Gallup generic ballot is out. Republicans have jumped to a 49-43 advantage, which National Review Online says is the largest Republican lead in 60 years.
Given the historical accuracy of the Gallup generic ballot in midterm elections, let’s plug this result in to the Swingometer.
[More]
Since my Swingometers are using terminology more often used in discussion of British elections, not American, it’s not surprising that some are unclear on just how they work.
Here’s an explanation.
[More]
The new Gallup generic ballot is out. Last time, it was even: 46-46. The two times before that it was at 45-45. Now it’s at R 46-D 45. Democrats have not led since March.
Gallup’s generic ballot is accurate in off year elections, so let’s see how that moves the Swingometer.
[More]
Some researchers led by Noah Smith at Carnegie Mellon tried an experiment: Could they predict the results of traditional polling, which has as its core feature a genuine random sample of people, with careful monitoring of Twitter?
[More]


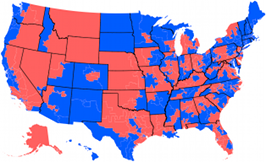 House of Representatives Swingometer
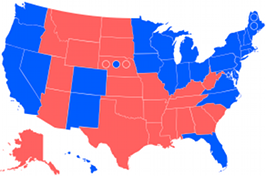 Electoral College Swingometer