The new Gallup generic ballot is out. Last time, it was even: 46-46. The two times before that it was at 45-45. Now it’s at R 46-D 45. Democrats have not led since March.
Gallup’s generic ballot is accurate in off year elections, so let’s see how that moves the Swingometer.
[More]
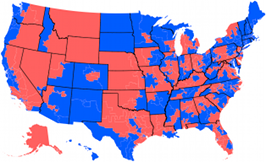
To join the House Swingometer I’ve now added the Electoral College Swingometer.
Obviously we need the 2010 Census to complete before we will know the actual makeup of the 2012 Electoral College, but for now I use the 2008 numbers.
Be jealous no more of those Brits with their fancy Swingometers. Now we too have one! Of course, the idea of a uniform national swing makes no more sense here than it did over there, but it can still be fun to play around with. So enjoy the 2010 Swingometer for the US House, for whatever it’s worth.
P.S. It takes a 15.1 swing toward Republicans to change control of the House.
[More]
Building on the work I did on the House races, let’s see what the latest Cook Political Report ratings suggest for the Senate elections in November.
[More]
The Cook Political Report’s House projections are rather conservative. In 2008 only one flip was not marked competitive, and that was Louisiana’s 2nd CD, in which Joseph Cao upset William Jefferson. I naturally give him a pass on that seat.
What do Cook’s 2010 projections say, and what do we learn from them?
[More]
Rasmussen released two new polls today. The Illinois and Delaware Senate races would seem to have little in common, but they do share a common element: they are being held for the seats vacated by Barack Obama and Joe Biden after their victory in November 2008.
Are voters inclined to send more Democrats to the Senate to work with them?
[More]
I found today’s polls to be dull, so I wanted to do something I found fun and maybe even interesting this morning. I wrote a simple, very crude simulator to project the Senate results based on the Real Clear Politics race categories. RCP rates races Safe, Likely, or Leaning for one party or the other unless it’s a Toss Up.
Here’s what I found.
[More]


 House of Representatives Swingometer
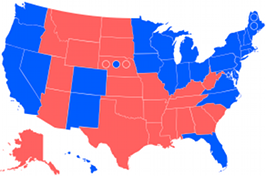 Electoral College Swingometer