I found today’s polls to be dull, so I wanted to do something I found fun and maybe even interesting this morning. I wrote a simple, very crude simulator to project the Senate results based on the Real Clear Politics race categories. RCP rates races Safe, Likely, or Leaning for one party or the other unless it’s a Toss Up.
Here’s what I found.
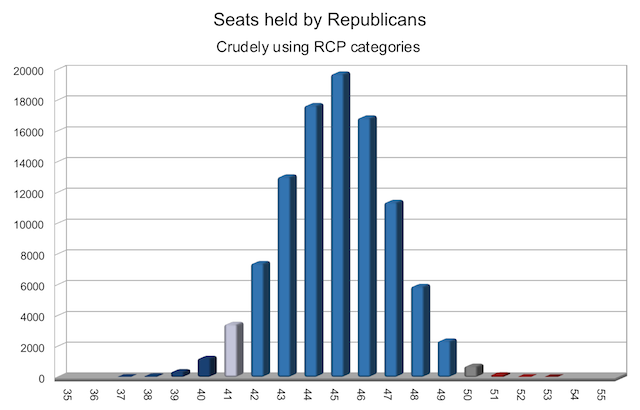
I assigned each category a probability of victory for the Republican: Safe Democrat seats, as well as any not listed and held by an incumbent Democrat, were set to 0. Likely Democrat was 1/6, Lean Democrat 1/3, Toss Up 1/2, Lean Republican 2/3, Likely Republican 5/6, Safe Republican and those not listed and held by Republicans 1.
For each simulation run I randomly assigned each Senate seat to the parties according to those probabilities. I then ran the simulation 100,000 times.
The mean number of seats for Republicans was 44. The maximum was 53, the minimum was 37. The mode was 45, making R+4 the most common result of the election. The full non-zero part of the distribution is pictured.
So if RCP is reading the polls correctly, they’re projecting a good year for Republicans but not a 1994-style revolution. That’s what happens when Democrats have 46 seats locked up, but Republicans only have 34, when counting seats not up for election plus those deemed safe.
Well, that was fun. I hope you enjoyed it. I know I did, though I’ll enjoy it more when the primaries are over and we have lots of polls for each important race, giving me more to work with than assigning numbers to somebody else’s categories.


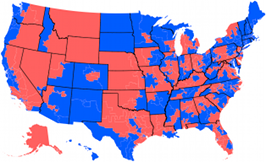 House of Representatives Swingometer
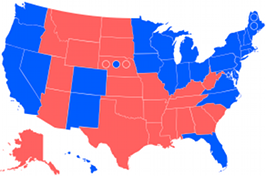 Electoral College Swingometer
Interesting. I guess it is still early yet.