I didn’t intend the second stage of my pollster grading series to come eleven days after my first stage, but then again I didn’t expect to suffer my worst cold in a long time, either.
So with my apologies for the unavoidable delay, we continue after a lost week by checking in on Public Policy Polling.
As I did with Rasmussen back on the 11th, I went and compared the relative performance of the Democrat in all the Governor’s races polled, comparing the actual results (per RCP) with the last poll. And as with Rasmussen, I showed no meaningful relationship between those gaps and either a state’s hispanic population or it’s population of adults with only wireless phones.
So how about the errors themselves, then? These polls generally ranged from 3 to 4 in Margin of Error, and the mean absolute error of the polls was 4.2. So PPP wasn’t “perfect,” but I’m forced to conclude that PPP was better than Rasmussen both in absolute terms, and relative to the Margin of Error.
I don’t compare the two to pick a fight, though. I only compare them because they are the first two I’ve looked at. This week (famous last words) I hope to check in on the Fox News, SurveyUSA, CNN/Time, and any other national pollsters I can get a good set of figures for.


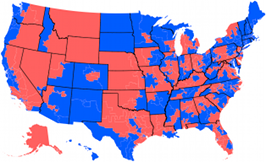 House of Representatives Swingometer
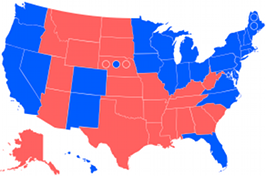 Electoral College Swingometer
Comments
No Responses to “Public Policy Polling: 2010 Scorecard”