Like everyone else, Rasmussen Reports got two key Senate races wrong, making them big surprises on election night: Colorado and Nevada. Rasmussen also underestimated Barbara Boxer’s lead in California.
My mission since election day has been to find out why everyone got these three states in particular so wrong, while others were accurate. In the process, I’ve taken a good look at Rasmussen’s accuracy this year.
I’ve looked specifically at Rasmussen’s polling of the races for Governor this year, comparing the amounts the Democrat was behind in the final poll with the actual result. I hoped to find a correlation between that figure and either the Hispanic population in the state or in the wireless phone-only population in the state.
As it turns out, I found nothing. OpenOffice tells me the correlation between the number of wireless-only adults and the Rasmussen gap is -0.01, meaningless. It got little better for the Hispanic figures: 0.13. And as I entered the figures it became clear to me visually that there was just nothing there.
However I was able to do one more thing, and that is test Nate Silver’s claim that Rasmussen was so far off. I averaged the absolute values of the errors and got 5.5. All of these polls had a Margin of Error of 4 or 4.5, so for the mean error to be beyond that is unlikely to be a random event. It’s more likely that Rasmussen’s likely voter screen was not quite accurate.
I intend to do other pollsters in the coming days. That work will give this datapoint the context we need.


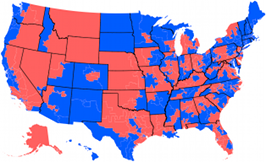
 House of Representatives Swingometer
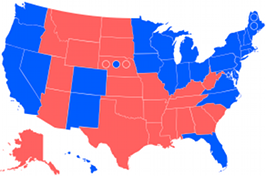
 Electoral College Swingometer
Comments
No Responses to “Rasmussen Reports: 2010 Scorecard”