I was discussing the Real Clear Politics ratings of the House with Moe Lane on Sunday, so I thought I might as well run some simulations based on those ratings.
In fact I did these twice: once for my usual scale, and once for Moe’s own probabilities for each category.
Typically I give a 1% chance of an upset for the ‘Likely’ category, a 10% chance for ‘Lean’, and 50% for ‘Toss-Up.’ I will run those, but I will also run them with Moe’s categories, which go 10/25/50 instead of 1/10/50. Moe’s probability assignments are just guesses, as he calls them, but he was looking at them this way and I got curious to see how my methodology matched up with his back-of-the-envelope calculations.
First off, the base situation: The GOP starts with 164 safe seats, and the Democrats start with 149 safe seats. 37 are lean or likely Republican, while 53 are lean or likely Democrat. 32 are Toss Ups. Of those 122 competitive seats, 15 are now held by Republicans.
Under my 1/10/50 model, that yields a 38 seat mean and modal gain after 100,000 trials, taking Republicans one shy of the majority at 218 D-217 R.
Under Moe’s guessed 10/25/50 model, which by its nature will swing more seats overall, and thus favor the party with fewer seats in play (in this case, the Republicans), Republicans gain 39 seats. That all-important extra seat brings Republicans to the 218 R-217 D majority.
Conclusion: The RCP ratings make the race very, very close right now.
As an aside, Moe’s back-of-the-envelope calculation came up with precisely that same result: Republicans take a one seat majority. It just proves that what I do here isn’t special and can be done by anyone given time and effort.


 House of Representatives Swingometer
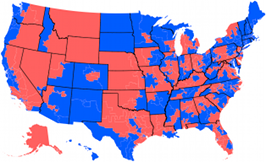
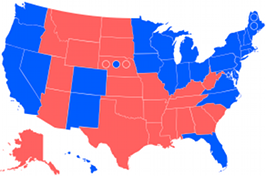 Electoral College Swingometer
I note that Gallup came up with a 11 point shift in generic ballot preference in two week or so.
From +6D to +5R
Mercy
It’s almost like they went back to normal after someone called them out, eh? :)