Welcome to Unlikely Voter! A plain summary of what this site is about can be seen in the About page, but I’ll now share the human side of that.
The idea for this site has been brewing a long time, and this launch has been a couple of months in the making. It’s been hard work, but I’ve enjoyed it. It’s exciting. I look forward to developing tools and ways of thinking about polling that are new to me and to my readers. I hope to find insights I would never have found if I just continued along with the same old armchair punditry I’ve been mailing in.
In the past I’d come up with nice, crunchy writing by doing analysis of federal budgets, but I can’t write enough on that because there’s only one budget a year. But polling, that’s an active, lively topic. There are elections almost every year, and every other year there are a number of dramatic, important elections which demand extensive analysis and projection. Further, I’m dissatisfied with the typical projection already done out there. I think too much focus is on the raw numbers that a pollster puts out, with no actual model behind it but easy arithmetic.
Nobody cares what percentage of the vote people get in a first-past-the-post system. What matters is who gets the most votes, with or without a majority. We need polls to tell us the probability that the Republican will win, and the probability that the Democrat will win. We also need the same for the aggregate of all polls for a race, and for all races in a national election cycle.
In my studies of existing work, I think Nate Silver does a fine job of taking his state-by-state projections and combining them into a national projection. I will have his work in mind when I do my own. What I dislike in his work, and in the work of every other poll analyst I’ve seen, is the way each individual poll is viewed, and the way the polls are combined for a given race.
Firstly, I think people tend to overly discredit any single poll. I hope to find ways to make sense of individual polls, and then build my whole framework on top of that. Well-crafted scientific polls are not chicken bones to be shaken and tossed for divination. If we trust them they have meaning, so let’s find that meaning.
Secondly, when aggregating those polls, there are other problems. Different polls have different sample pools, different sampling methods, different margins of error, and more. I believe it foolish, therefore, to try to combine the raw numbers in any way, including some sort of weighted average. That takes me back to the goal of analyzing individual polls, which I believe will be a major focus of my research going forward.
I want to find a way to abstract out those factors into one number which can then be combined across all polls. That number, I believe, is probability of victory (this site will use the as a convention the Republican’s probability of victory in a general election horse race, but 1 – p will give the Democrat’s).
How I take the three arguments any poll gives (Candidate 1’s percentage, Candidate 2’s percentage, and the margin of error) and turn those into a single probability of victory, may vary over time. My goal is to find the most accurate way to do that. In fact, if some day I find a better way of boiling down a poll than probability of victory, I will use that.
I don’t know yet know the best way to do any of this, but finding it will be a fun ride. Please go easy on my math, though. I haven’t integrated anything in about a dozen years. I expect to be rusty.
Thanks for reading and again welcome,
Neil Stevens


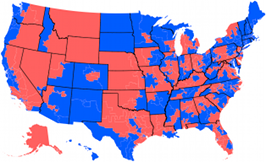
 House of Representatives Swingometer
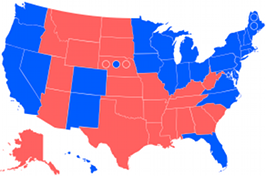
 Electoral College Swingometer
Looks great and user friendly.
I will be dropping by and check frequently.