Ten years ago, Gallup started polling the opinions Americans had of various industries. Two years later, the US Government was thrown into the mix. Monday, Gallup looked back to see how they’ve all done over the last decade.
It turns out the Federal Government is now less popular than any polled industry. Including Bankers, Lawyers, and Oil men.
It didn’t used to be that way. In 2003, the first year the government was added to the poll, it had a net +6 favorable rating, 41/35. A 41/35 rating this year would have put the government 12th of the 24 industries (+ government for 25 total) that were polled.
But as it turns out, the government hasn’t kept that rating. By 2004 the government was in the negative, and by 2008, the last year of the George W Bush administration, the government was running at a -42 net, 18/60. That number rebounded in 2009, after the election of Barack Obama, to a -25 net, 29/54, but has worsened again in every year since.
So now under Obama the result is slightly worse than it ever got under Bush, having dropped to a -46 rating, 17/63, which is dead last in the poll. The oil industry was slightly better off, despite the gulf and high gas prices, at a -44. Bailouts haven’t dragged banks nearly as far, as they only register a -17, while perennial pincushion lawyers only hit a -16.
The Computer industry is at the top of the chart at a huge +62, far away from the next two, restaurants at +49 and Internet at +40.
Interestingly, the Banks at -17 have fallen precisely that far over the last ten years, 17 points. Oil was previously at the bottom, only having dropped four points over the decade, but the government has crashed 24 points, the biggest drop on the table, and in only eight years, while the other industries had ten.
It’s hard to project electoral results from this, as George W Bush won solidly in 2004 despite a net -5, and there was no incumbent in 2008 when the government was at a net -42. Further, these kinds of polls can be misleading. Often the US Congress will get horrible approval ratings, but every year most incumbents win re-election.
Caveats aside, I do find it interesting that Obama’s election did shift this poll from a -42 to a -25 just after Obama’s election, and I suspect Presidential approval is pretty closely tied with the overall government’s approval. We’ve already seen that the President’s down, as well.


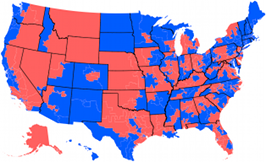
 House of Representatives Swingometer
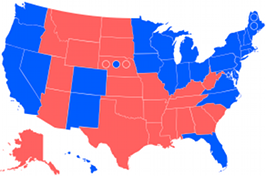
 Electoral College Swingometer
Neil this is a general question not directed at this particular post.
Many of the presidential polls do not provide cross tabs so that we can see the sample size of the political parties. However they often tell us the number sampled the percentages for the candidates over all and by party. On its face, this seems enough information to work backwards and determine the sample size by party. Is this true and if not why not? If it is possible, would you consider putting up a page that facilitates such reverse calculations?
I enjoy this site a great deal and am looking forward the increase in polls that we’ll see as the primaries and elections get closer.
Thanks!
Well the trick is we don’t know who the independents are. Also, some states don’t even have partisan registration, so it get tricky.