Now that the unpleasantness of the Research 2000 polling is fading from memory, and the Public Policy Polling deal is churning out results, it looks like Daily Kos is again trying to be a hub of political polling. The republishing of the Chris Bowers Senate projections would seem to be part of that.
His methodology has some strong points that I could be in favor of, so I thought I’d give it an in depth look and compare his latest numbers with my own Senate projection based on polling.
First off, Bowers doesn’t do every race. I’ve handicapped all 37 seats, including all the ones I only give one side an 0.1% chance of winning. Bowers only does the 16 races he considers closest. It’s been ten days, and polling happens constantly, but on the 13th my 16 closest races were CA, CO, CT, FL, IL, KY, LA, MO, NH, NV, NC, OH, OR, PA, WA, WI. Bowers omits Oregon and adds Delaware, and for each of us those states are on the fringes of competitiveness, so we at least agree on what the battleground is.
But even if we agree on what states matter, how off are we on the odds for the parties in each state? Let’s check, with a quick bit of math to convert my percentages for the Republican, to his percentages for the Democrat. I’m using his numbers with Rasmussen Reports, because I see no valid reason to omit those. Even Public Policy Polling is moving sharply in RR’s direction since shifting from Registered Voters to Likely Voters.
| State | Unlikely Voter | Bowers |
|---|---|---|
| Connecticut | 85% | 98% |
| California | 55% | 83% |
| Washington | 60% | 80% |
| Florida* | 45% | 79% |
| Nevada | 55% | 69% |
| Illinois | 40% | 68% |
| Wisconsin | 55% | 32% |
| Colorado | 45% | 22% |
| North Carolina | 30% | 6% |
| Missouri | 25% | 4% |
| Ohio | 30% | 4% |
| Pennsylvania | 35% | 3% |
| New Hampshire | 20% | 2% |
| Kentucky | 25% | 3% |
| Louisiana | 10% | 1% |
| Delaware | 5% | 0% |
| Rows where I give the Democrat a better shot than Bowers does are highlighted | ||
| * Bowers’s 79% is actually his chance that Crist, not the Democrat, will win, while my 45% is the chance that Rubio will lose. | ||
It’s obvious what’s going on: Bowers’ model is polarizing. He has no true tossups, with the two closest seats at 68% and 32%, and not coincidentally that’s the line between the seats I’m more optimistic for Republicans about than he is, and the seats I’m more pessimistic about.
Now, there are good reasons that his numbers will be so much more polarized than mine, starting with the fact that my projection is a deliberately naive poll-based calculation, while Bowers is attempting a more sophisticated projection based heavily on data mining past elections. But it’s still promising for both of us that we only disagree on the favorite for three seats: Bowers favors Giannoulias, Johnson, and Crist, while I favor Kirk, Feingold, and Rubio (though recent pro-Johnson polling could flip my next projection in Wisconsin).
His overall calculation is that the Democrats are most likely to lose 7 seats, while I came up with 6. Though if I run my simulation using his numbers instead of my own (with 0% chance of upset for every race he does not list, which includes flips in what I assume are AR, ND, and IN), I only come up with a 6 seat mean and mode.
And one of his commenters, Dbug, also came up with a 6 seat loss being most likely for them using a Markov Chain on the Bowers numbers rather than my Monte Carlo approach. Statistically both methods should converge though, and in this case they do.
So in short, Bowers and I largely seem to agree on the damage for the Democrats, but we disagree on how to get there.


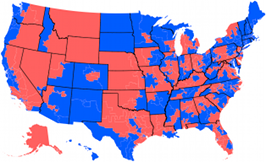
 House of Representatives Swingometer
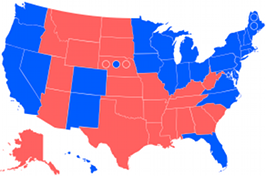
 Electoral College Swingometer
What does your model say when you use Intrade numbers for senate races?
state D/R
AL -/90
AK 10/90
AZ 12/88
AR 5/95
CA 61/36
CO 33/68
CT 73/29
DE 19/81
FL 6/60/34 Crist
GA 10/90
HI 80/20
ID -/90
IL 52/53
IN 10/94
IA 10/85
KS no bid
KY 24/75
LA 10/90
MD 95/20
MO 16/88
NV 59/45
NH 30/80
NY 90/13
NY 85/10
NC 16/86
ND 3/89
OH 50/76
OK 15/90
OR 80/7
PA 19/70
SC -/90
SD 20/- ??
UT -/85
VT -/10
WA 50/49.9
WV 84/51
WI 60/43
Not sure How I’d use those numbers because they’re not self consistent, in that they usually don’t sum to 100 :)