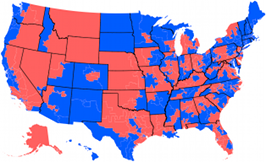
On Thursday the latest House ratings from the Cook Political Report came out. I think it’s high time we re-ran those numbers in a simulation of the national election, and see what the ratings suggest for November.
As of now the table heavily leans one way, quoth Cook:
Likely: These seats are not considered competitive at this point but have the potential to become engaged.
Lean: These are considered competitive races but one party has an advantage.
Toss-Up: These are the most competitive; either party has a good chance of winning.
Democrats currently have 64 seats listed as Lean or Toss Up.
Republicans currently have 7 seats listed as Lean or Toss Up.
As before I’ve assigned Likely seats a 1% chance of going for the other party, Lean seats a 10% chance, and Toss Up seats a 50% chance, and run the election 10,000 times to see how things look.
And with the current Cook ratings, the most likely outcome is a 20 seat Republican gain, unchanged from May.
Does this mean a wave may not be coming? Not in the least. For perspective, I ran the same 10,000 trial simulation for the June 19, 2008 ratings of Cook’s. At that point the table tilted toward the Democrats with Republicans having 29 seats at Lean or Toss-Up vs 19 for the Democrats, and the most likely outcome was a 7 (mode) or 8 (mean) seat gain for the Democrats.
If you recall, Democrats went from that 7-8 seat projection in Cook’s conservative early ratings, to a 21 seat win in November. So if Republicans are at +20 now, there’s plenty of reason to believe Cook will slide further in that direction over the next few months.


 House of Representatives Swingometer
 Electoral College Swingometer
Comments
No Responses to “Simulating the latest Cook House ratings”