Political people love the illusion of accuracy. Political pollsters and analysts should not feed into that by feigning precision that does not exist.
If we’re going to call it ‘scientific polling,’ and we do every time some random Internet survey is circulated that doesn’t follow the conventions of scientific polling, then the way we write about polling must also be scientific.
An oft-overlooked concept in scientific reporting is “significant figures.” Significant figures describe writing a number to communicate how accurately we know what that number is. Sound complicated? Let me give an example.
Let’s say we need to measure a strip of paper to do an experiment. Our ruler is marked in inches and tenths of an inch. We measure the paper and we see that the paper goes somewhere just past the mark for 1.4. So, we say “1.4.” That measurement has two significant figures. It doesn’t have three or four, because we can’t say for sure if it’s 1.41, or 1.42, or 1.405. It’s just 1.4.
Individual polls don’t need to use significant figures. Instead they tell us precisely what the margin of error is. They’ll tell us that Donald Trump is running at a 44.5% approval rating, with a margin of error of 4.
To bring that back to the ruler, it would be like saying the piece of paper was 1.405 inches long, with a margin of error of 0.02 inches. As you can see, that “0.005” is virtually meaningless, because the margin of error dwarfs it.
Significant figures carry over even when you do math. If you take that 1.4 inches and divide by 8, the answer isn’t 0.175 inches. The answer is 0.18. You still only have two significant figures. Dividing by 8 does not make your data somehow more precise than it was to start with.
This carries over to poll averages. You can’t take 10 polls with margins of error of 3, 4, 5, 2, and 6.4, average them, and get something that’s accurate to one decimal place. That’s just not the way it works, and to write a poll average with a decimal place misleads anyone reading it.
You just can’t say that Donald Trump has 44.3% approval, or that his net approval is -11.4, when you’re working with margins of error well above 1.
It may be case that a poll average is more accurate than any given poll. But it is not more precise than the polls that were used to make it. It can’t be, it won’t be, and it shouldn’t be written as though it were.


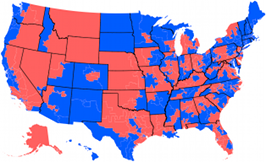
 House of Representatives Swingometer
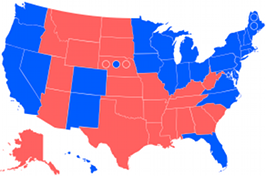
 Electoral College Swingometer